You need to be able to look at how a currency pair has performed in the past and evaluate what its current behaviour looks like to be able to analyse the price movements of a currency pair. Only then will you be able to figure out how its price will move in the future. A price Forex Charts is the first piece of analysis that any trader who wants to use technical analysis needs to learn how to use. A chart essentially provides a visual representation of how the price of the currency pair has changed over the period. It is a useful tool for visualizing all the trading actions that take place within a specific forex trading period, whether that period is 10 minutes, 4 hours, a day, or a week. Visit MultiBank Group
A forex chart can be used to do research and analysis on any financial instrument for which it is easy to get information about how its price has changed over a certain time. Price changes are often caused by a series of events that don’t seem to be related to each other. Because of this, we should do everything we can to try to predict these events and manage the risks we face. The use of charts can be extremely helpful in situations like this. Forex trading Charts are user-friendly in the sense that anyone can quickly view a chart and comprehend the changes in price that it depicts. They make it much easier to keep track of and analyse a currency pair’s changes, patterns, and tendencies.
The chart is organized such that the y-axis (vertical axis) displays the price scale, while the x-axis (horizontal axis) displays the time scale. Along the x-axis, the prices are written in order, moving from left to right.
Different Kinds of Price Charts
The following are the three types of price charts that are the most common:
- Line chart
- Bar chart
- Chart with candlesticks
Line Chart
A straightforward line chart in forex trading is essentially just a line that is drawn from one closing price to the next closing price after that. This line illustrates how the overall price movement has been for a specific currency pair over the course of time by showing how it has fluctuated over time. Even though the line chart is easy to understand, it doesn’t usually tell you much about how prices have changed over time. The only piece of information you obtain is the time at which the price was finalized.
The trader, on the other hand, will benefit from having a clear picture of the trends and being able to contrast one closing price with the one that comes after it.
This chart will typically provide an overview, or “big picture,” view of how the prices move. The line chart also illustrates trends in the most accurate way possible, which is by using a slope to do so. When compared to the open, high, or low levels, the closing level is often given greater importance by certain traders. If you only pay attention to the closing price, you will notice that there are changes in price. During a trading session, these factors are ignored.
Bar Chart
A bar chart in forex trading is typically more difficult to understand than a pie chart. It shows the prices at the beginning and end of each period, as well as the highest and lowest prices during that period and the price range for that period.
It’s possible that the size of each bar will continue to grow or shrink either sequentially or possibly over the course of a series of bars. The lowest price that was traded for a specific amount of time may be found at the very bottom of the bar on the graph. while the price that was paid for the item is indicated by the bar at the very top of the graph. The vertical bar itself shows the entire trading range of the currency pair.
Large bars are the result of price swings that are volatile. As they begin to find their equilibrium, the bars, in response to their stability, begin to shrink in size. Due to the way the bars are manufactured, the bar size is in a constant state of flux. The height of the bar shows how much the prices changed between high and low during the time shown by the bar. Know more مجموعة ملتي بانك
With the help of connected horizontal lines, the price bar also shows the prices at the beginning and end of the time. The initial price is represented by the horizontal hash to the left of the bar, and the closing price is shown by the horizontal hash to the right of the bar. En özel ve reel kızlar Şirinevler Escort Vip Bayan Dilay | İstanbul Escort Bayan sizleri bu platformda bekliyor. Each bar on the graph illustrates a different time, which could be anything from one hour to one week at a time.
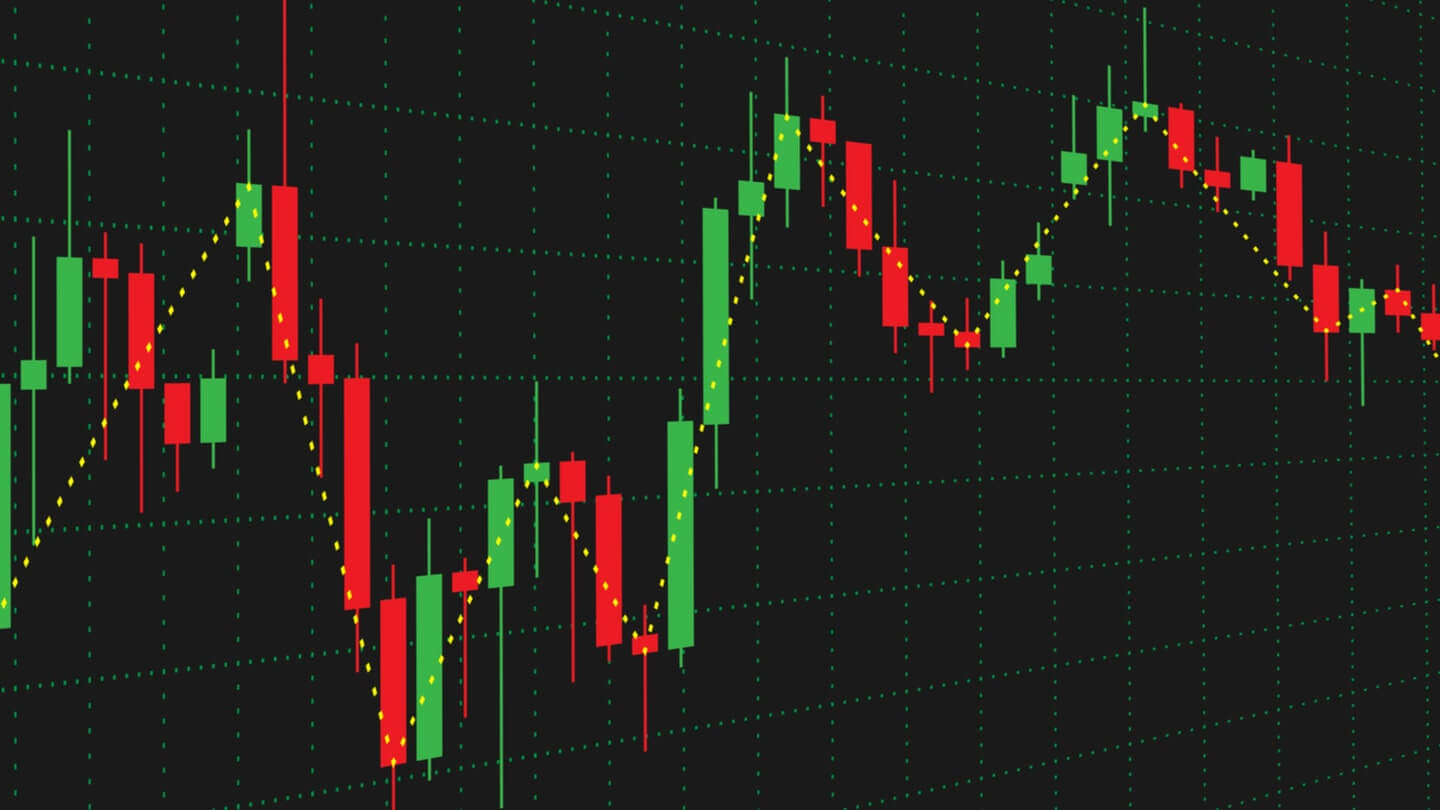
Charts Based on Candlesticks
In its most basic form, the candlestick chart in forex trading is a variant on the bar chart. The information is the same as what we see on a bar chart; the difference is that this presentation is far more pleasing to the eye. Most merchants favour it, not due to its aesthetic appeal, but rather since these charts are considerably simpler to comprehend overall. To illustrate the high-to-low range, candlestick bars employ a vertical line. In contrast, the larger block (or body) in the middle of a candlestick chart shows the range of prices that happened between the opening and closing values. Forex charts broken down by kind, with instructions on how to read each one.
Read More: Top Forex Trading Risks That Most Traders Fear
The employment of different colours in the bodies of candlesticks is a valuable indicator that may be used to show whether the current market sentiment is bullish or bearish. Typically, if the central block is coloured. If this is the case, the closing price of the forex currency pair is lower than the opening price. The price at the top indicates the opening price, and the price at the bottom indicates the closing price. If the closing price is higher than the opening price, then the block in the middle will be unfilled, also known as “hollow.” When making charts, candlesticks are only used to show what’s going on visually, because a bar chart displays the same information.